题目内容
【题目】Last year, some groups of students in their community made a survey about “How do people spend their free time?” The following diagrams show some results of it:
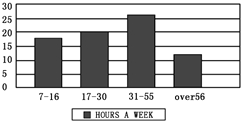
Diagram (1): Hours for people of different ages who surf the Internet in a week.
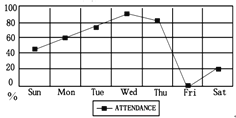
Diagram (2): Different days people go to the library. ( library attendance )
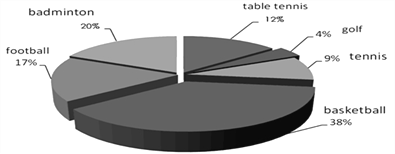
Diagram (3): Different sports people like.
D (1) D(2)
 D (3)
D (3)
【1】People aged spend the most time surfing the Internet every week.
A. 7~16 B. 17~30 C. 31~55 D. over 56
【2】The word “attendance” in Diagram (2) means “ in the library”.
A. the hours people spend B. the number of people
C. the number of books D. the days people spend
【3】How many people go to the library on Saturdays?
A. About 20%. B. About 40%.
C. Over 60%. D. More than 80%.
【4】Which of the following is TRUE according to the diagrams?
A. The fewest people like playing tennis.
B. Football is the most people’s favorite sport.
C. People seldom go to the library on weekdays.
D. The most people like playing basketball.
【5】The three diagrams show us the results of a survey about .
A. what people do every day B. people’s different habits
C. people’s different lifestyles D. how people spend their free time
【答案】
【1】C
【2】B
【3】A
【4】D
【5】D
【解析】本文介绍了一些学生对“人们如何度过业余时间”的调查结果。
【1】C
推理判断题。根据Diagram (1)柱形图里展示的内容,31~55岁的人一周内上网的时间最长,故选C。
【2】B
推理判断题。根据Diagram (2): Different days people go to the library. ( library attendance )可知在Diagram (2)中attendance表示的意思是在一周不同的日子里,去图书馆的人数,故选B。
【3】A
细节理解题。根据Diagram (2)可知在星期六去图书馆的人数占大约20%,故选A。
【4】D
推理判断题。根据Diagram (3):可知喜欢打高尔夫球的人占9%,喜欢打网球的人占9%,喜欢打乒乓球的人占12%,喜欢踢足球的人占17%,喜欢打羽毛球的人占20%, 喜欢打篮球的人占38%,因此喜欢打篮球的人数最多,故选D。
【5】D
概括归纳题。根据Last year, some groups of students in their community made a survey about “How do people spend their free time?” The following diagrams show some results of it: 可知这三个表向我们展示了对“人们如何度过业余时间”的调查结果,故选D。

 海淀黄冈名师导航系列答案
 普通高中同步练习册系列答案
 优翼小帮手同步口算系列答案