题目内容
【题目】阅读下面材料,然后从各题所给的四个选项中选出一个最佳答案。
A
Global travel national tourist arrivals in millions
2005 statistics(统计资料) 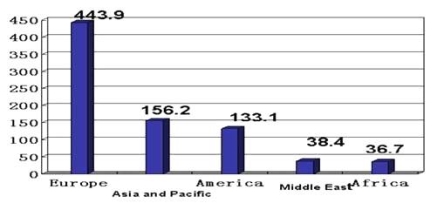
(1)During which interval was there the greatest increase of global travel?
A.Between 2001-2002.
B.Between 2003-2004.
C.Between 2002-2003.
D.Between 2004-2005.
(2)Which is true about the diagram(图表)?
A.The diagram shows there will be a steady (稳固的) increase of global travel over the next few years.
B.Global travel suffered a slight drop every year from 2000 to 2003.
C.The number of tourists increased by 21 million from 2001 to 2002.
D.Tourists from Europe made up half of the total in 2005.
(3)This diagram is mainly about ______.
A.different destinations(目的地)for tourists
B.statistics of global travel from 2000 to 2005
C.the prediction(预言)of international tourists arrivals.
D.the tendency(趋势)of global travel
【答案】
(1)B
(2)C
(3)B
【解析】本文是关于世界旅游人数的调查。
(1)细节理解题,根据图表可知在2003年到2004年,全球旅行增长最大,故选B。
(2)细节理解题,根据图表可知从2001到2002,游客的数量增加了2100万,故选C。
(3)细节理解题,联系图表可知这是关于从2000到2005的全球旅游统计,故选B。