题目内容
14.Last year,some groups of students in their community made a survey about"How do people spend their free time?"The following diagrams show some results of it:Diagram (1):Hours for people of different ages who surf the Internet in a week.
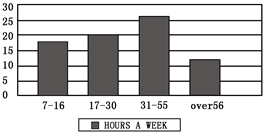
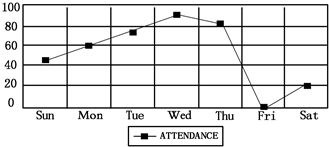
Diagram (2):Different days people go to the library.(library attendance)
 (%)
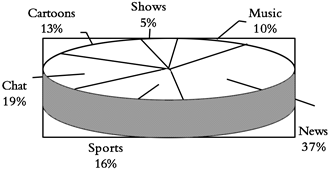
(%)Diagram (3):Different programs people like.
38.People agedC spend the most time surfing the Internet every week.
A.7-16
B.17-30
C.31-55
D.over 56
39.How many people go to the library on Saturdays?A
A.About 20%.
B.About 40%.
C.Over 60%.
D.More than 80%.
40.Which of the following is TRUE according to the diagrams?D
A.The fewest people like watching music programs.
B.Sports are the most people's favorite programs.
C.People seldom go to the library on weekdays.
D.Half of the people like watching news and cartoons.
41.The three diagrams show us the results of a survey about.D
A.what people do every day
B.people's different habits.
C.people's different lifestyles
D.how people spend their free time.
分析 文章大意:这篇文章主要告诉我们人们如何度过空余时间的调查结果,提供了三个图表.图表一是不同年龄段人每周的上网时间;图表二是人们一周内每天去图书馆的情况;图表三是人们喜欢的节目.
解答 38-41:CADD
38题答案:C 细节理解题.从图表一中可知年龄在31至55岁的人每周上网的时间最多.故选C.
39题答案:A 细节理解题.从图表二中可知大约20%的人周六去图书馆.故选A.
40题答案:D 细节理解题.从图表三中可知人们喜欢的是新闻频道是37%,喜欢看动画片的是13%,两者加一起是50%,所以D 正确.故选D.
41题答案:D 主旨大意题.这篇文章主要告诉我们人们如何度过空余时间的调查结果.故选D.
点评 本文是一篇日常生活类阅读,题目涉及多道细节理解题,做题时结合原文和题目有针对 性找出相关语句进行仔细分析,结合选项选出正确答案.推理判断也是要在抓住关键句子的基础上合理的分析才能得出正确的答案.

练习册系列答案
 全优点练单元计划系列答案
相关题目
