题目内容
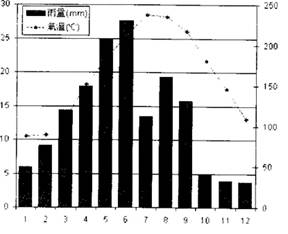
阅读下边的图表,完成小题。

小题1:We can learn from the chart that it rained mostin _______
小题2:It’s hottest in _______ and coldest in _______.

小题1:We can learn from the chart that it rained mostin _______
| A.September | B.June |
| C.July | D.May |
| A.July; January | B.May; November |
| C.August; February | D.June; December |
小题1:B
小题2:A
试题分析:本题是一个关于年降水量与气温变化的统计图
小题1:根据图表显示,可知在六月下雨最多,故选B。
小题2:根据图表显示,可知在七月最热,在一月最冷,故选A。
点评:解答此类题型的关键是要具有基础的图表知识,知道图表中数据所代表的含义。然后根据小题要求选择合适答案。

练习册系列答案
 天天向上一本好卷系列答案
 小学生10分钟应用题系列答案
相关题目
