题目内容
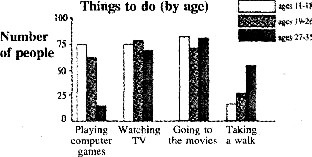
22、We Surveyed(调查)300 young people on what they like to do at weekends.One hundred people are from the ages of 11-18,one hundred 19-26 and one hundred 27-35.The following chart shows their answers.

1.How many people enjoy playing computer games in the l l-18 group?
A.20. B.50. C.60. D.75.
2.The people of 19- 26 enjoy _______ most.
A.watching TV B.going to the movies
C.playing computer games D.taking a walk
3.According to the chart,which two activities do most people enjoy doing?
A.Playing computer games and watching TV.
B.Playing computer games and taking a walk.
C.Watching TV and going to the movies.
D.Going to the movies and taking a walk.
4.From the chart above,we can see the older people are, the more they like to _______.
A.watt-h TV B.take a walk
C.go to the movies D.play computer games
5.Which of the following is TRUE according to the chart?
A.Fewest people like taking a walk.
B.The people of 11-18 like taking a walk most.
C.90 people like going to the movies in the l9-26 group.
D.The people of 27-35 like playing computer games most.
|
评卷人 |
得分 |
|
|
|
五、书面表达
(每空? 分,共? 分)
试题答案
22、DACCA
五、书面表达
We Surveyed(调查)300 young people on what they like to do at weekends.One hundred people are from the ages of 11-18,one hundred 19-26 and one hundred 27-35.The following chart shows their answers.
1.How many people enjoy playing computer games in the l l-18 group?
A.20. B.50. C.60. D.75.
2.The people of 19- 26 enjoy _______ most.
A.watching TV B.going to the movies
C.playing computer games D.taking a walk
3.According to the chart,which two activities do most people enjoy doing?
A.Playing computer games and watching TV.
B.Playing computer games and taking a walk.
C.Watching TV and going to the movies.
D.Going to the movies and taking a walk.
4.From the chart above,we can see the older people are, the more they like to _______.
A.watt-h TV B.take a walk
C.go to the movies D.play computer games
5.Which of the following is TRUE according to the chart?
A.Fewest people like taking a walk.
B.The people of 11-18 like taking a walk most.
C.90 people like going to the movies in the l9-26 group.
D.The people of 27-35 like playing computer games most.
查看习题详情和答案>>We surveyed(调查)300 young people on what they like to do at weekends. One hundred people are from the ages of 11-18, one hundred 19-26 and one hundred 27-35. The following shows their answers:
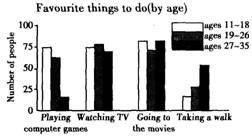
62. How many people enjoy playing computer games in the 11-18 group?
A. 20 B. 50 C. 75 D. 80
63. The people of 19- 26 likes ______ best.
A. watching TV B. going to the movies
C. playing computer games D. taking a walk
64. Which two activities do most of the people doing?
A. Playing computer games and watching TV
B. Playing computer games and taking a walk.
C. Watching TV and going to the movies.
D. Playing computer games and going to the movies.
65. Which of the following is true?
A. The people between 11-18 don’t like taking a walk.
B. The people of 27-35 like watching TV best.
C. People between 19-26 don’t like playing computer games at all.
D. The people between 11-18 like watching TV best.
查看习题详情和答案>>