网址:http://m.1010jiajiao.com/timu_id_786562[举报]
Diagram (1): Hours for people of different ages who search the Internet in a week.
 |
Diagram (2): Different days people go to the library. (library attendance出席)
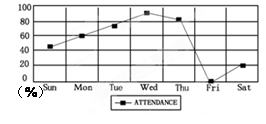
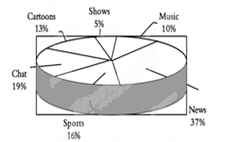
Diagram (3): Different programs (节目) people like.
小题1:People aged spend the most time searching the Internet every week.| A.7-16 | B.17-30 |
| C.31-55 | D.over 56 |
小题2:How many people go to the library on Monday?| A.About 20% | B.About 60% |
| C.Over 80% | D.More than 40% |
小题3:Which program do people like best?| A.Cartoons | B.Sports |
| C.News | D.Music |
小题4:The three diagrams show us the results of a survey about .| A.what people do every day | B.people’s different habits |
| C.people’s different lifestyles | D.how people spend their free time |
Last year, some groups of students in their community made a survey (调查) about “How do people spend their free time? ” The following diagrams(图表) show some results(结果) of it:
Diagram (1): Hours for people of different ages who search the Internet in a week.
 |
Diagram (2): Different days people go to the library. (library attendance出席)

Diagram (3): Different programs (节目) people like.

【小题1】People aged spend the most time searching the Internet every week.| A.7-16 | B.17-30 |
| C.31-55 | D.over 56 |
【小题2】How many people go to the library on Monday?| A.About 20% | B.About 60% |
| C.Over 80% | D.More than 40% |
【小题3】Which program do people like best?| A.Cartoons | B.Sports |
| C.News | D.Music |
【小题4】The three diagrams show us the results of a survey about .| A.what people do every day | B.people’s different habits |
| C.people’s different lifestyles | D.how people spend their free time |
Last year, some groups of students in their community (社区) made a survey about "How do people spend their free time?" The following diagrams show some results of it:
Diagram (1): Hours for people of different ages who surf the Internet in a week.
Diagram (2): Different days people go to the library. (library attendance)
Diagram (3): Different programs people like.
根据上面三个图表内容,选择正确答案。
【小题1】People aged spend the most time surfing the Internet every week.
| A.7—16 | B.17—30 | C.31—55 | D.over 56 |
| A.the hours people spend | B.the number of people |
| C.the number of books | D.the days people spend |
| A.over sixty | B.less than sixty |
| C.about twenty | D.more than one hundred |
| A.The fewest people like watching music. |
| B.Sports are the most people's favorite programs. |
| C.People seldom go to the library on weekdays. |
| D.Half of the people like watching news or cartoons. |
| A.what people do every day |
| B.how people spend their free time |
| C.people's different lifestyles |
| D.people's different habits |
Last year, some groups of students in their community (社区) made a survey about "How do people spend their free time?" The following diagrams show some results of it:
Diagram (1): Hours for people of different ages who surf the Internet in a week.

Diagram (2): Different days people go to the library. (library attendance)

Diagram (3): Different programs people like.

根据上面三个图表内容,选择正确答案。
1.People aged spend the most time surfing the Internet every week.
A.7—16 B.17—30 C.31—55 D.over 56
2.The word "attendance" in Diagram (2) means " in the library".
A.the hours people spend B.the number of people
C.the number of books D.the days people spend
3.On weekends, people go to the library every week.
A.over sixty B.less than sixty
C.about twenty D.more than one hundred
4.Which of the following is true according to the diagrams?
A.The fewest people like watching music.
B.Sports are the most people's favorite programs.
C.People seldom go to the library on weekdays.
D.Half of the people like watching news or cartoons.
5.The three diagrams show us the results of a survey about .
A.what people do every day
B.how people spend their free time
C.people's different lifestyles
D.people's different habits
查看习题详情和答案>>
Diagram (1): Hours for people of different ages who surf the Internet in a week.

Diagram (2): Different days people go to the library. (library attendance)

Diagram (3): Different programs people like.

根据上面三个图表内容,选择正确答案。
小题1:People aged spend the most time surfing the Internet every week.
| A.7—16 | B.17—30 | C.31—55 | D.over 56 |
| A.the hours people spend | B.the number of people |
| C.the number of books | D.the days people spend |
| A.over sixty | B.less than sixty |
| C.about twenty | D.more than one hundred |
| A.The fewest people like watching music. |
| B.Sports are the most people's favorite programs. |
| C.People seldom go to the library on weekdays. |
| D.Half of the people like watching news or cartoons. |
| A.what people do every day |
| B.how people spend their free time |
| C.people's different lifestyles |
| D.people's different habits |