题目内容
Diagram (1): Hours for people of different ages who search the Internet in a week.
 |
Diagram (2): Different days people go to the library. (library attendance出席)
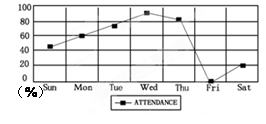
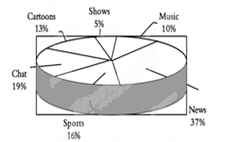
Diagram (3): Different programs (节目) people like.
小题1:People aged spend the most time searching the Internet every week.| A.7-16 | B.17-30 |
| C.31-55 | D.over 56 |
小题2:How many people go to the library on Monday?| A.About 20% | B.About 60% |
| C.Over 80% | D.More than 40% |
小题3:Which program do people like best?| A.Cartoons | B.Sports |
| C.News | D.Music |
小题4:The three diagrams show us the results of a survey about .| A.what people do every day | B.people’s different habits |
| C.people’s different lifestyles | D.how people spend their free time |
小题1:C小题2:B小题3:C小题4:D试题分析:这篇文章主要告诉我们人们如何度过空余时间的调查结果,提供了三个图表。图表一是不同年龄段人每周的上网时间;图表二是人们一周内每天去图书馆的情况;图表三是人们喜欢的节目。小题1:细节理解题。从图表一中可知年龄在31至55岁的人每周上网的时间最多。故选C。小题2:细节理解题。从图表二中可知大约60%的人周一去图书馆。故选B。小题3: 细节理解题。从图表三中可知人们最喜欢的是新闻频道。故选C。小题4:主旨大意题。这篇文章主要告诉我们人们如何度过空余时间的调查结果。故选D。
练习册系列答案
相关题目

 may hurt children’s study habits. “I think WI-FI is not necessary for kids.” says Zeng Wenwen,43, Beijing.