题目内容
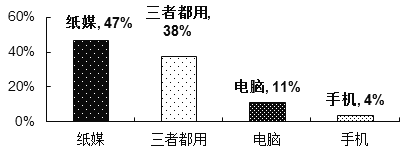
【题目】下面的柱状图(bar chart)显示了你校上周针对“用电脑,手机和纸媒学习”的调查结果。请你用英语给21st Century报社写一篇短文,报道你校的调查结果,并对此结果发表你的看法。 注意:词数100左右。
____________________________________________________________________________________________
____________________________________________________________________________________________
____________________________________________________________________________________________
____________________________________________________________________________________________
____________________________________________________________________________________________
____________________________________________________________________________________________
___________________________________________________________________
【答案】Dear Editor,
We made a survey in our school last week and I’d like to tell you something about the results.
As is demonstrated in the bar chart, using papers to study occupies 47%, followed by the percentage of 38% students in my school, who get used to use all the three means of study. 11% of the students surveyed prefer to use computers. Students who think smartphones can help their study account for the rest of 4%.
Apparently, the traditional way of study students read books and take notes in pen is still the choice by most students. Computers or phones usage is supposed to do harm to eyesight, which is the reason why a small number of students choose. As far as I am concerned, if used properly, all these means of study can benefit us.
【解析】本文是一篇图表作文。图表作为书面表达的一种信息提示方式,显得简洁明了,正被越来越多的各级各类英语考试所采用。图表类作文有别于其他类型,它要频繁描述具体数据、进行数据比较,并说明数据变化。考生应仔细分析图表,引证典型数据并按提纲要求进行取材与构思。审题时一定要领会作者的出题意图,弄清主题再动笔。通常写作时我们使用三段论:第一段描述图表,得出结论;第二段紧扣主题,根据图表比较分析原因,论证结论;第三段发表议论,提出自己的看法。写作时要注意两个方面:1、单纯描述解释图表信息,按照 图表所示内容如实表达,不加评论;2、通过叙述图表中的内容和数字的变化来分析原因,发表议论。