网址:http://m.1010jiajiao.com/timu3_id_2422624[举报]
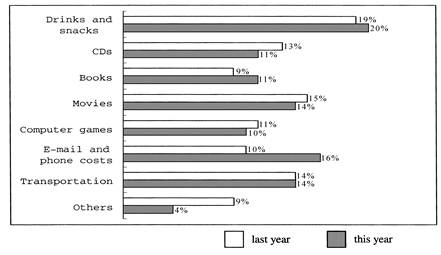
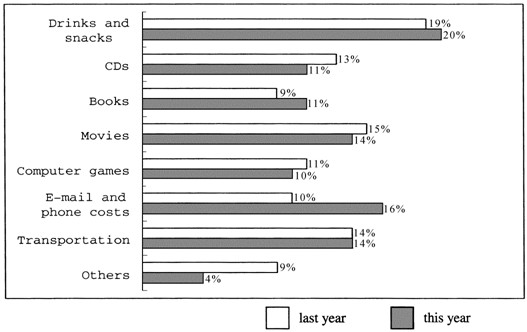
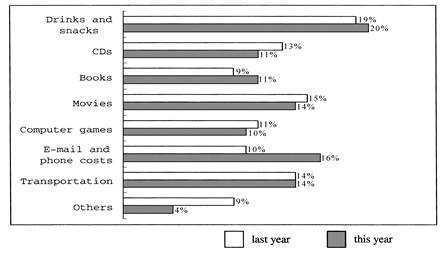
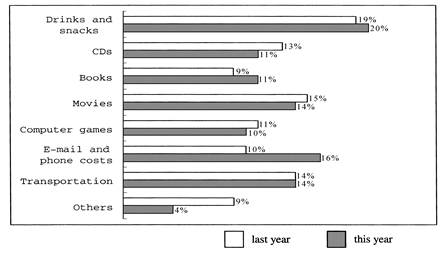
We wanted to study how students at our school spend money. In order to study this, we made some questions to ask our classmates. First, we asked our classmates how much money they spent in one month. Then we asked how much money they spent on things like drinks, music, books, movies, computer games, and other things. Our math teacher helped us make a graph of our classmates’ answers.
Then we thought it would be interesting to compare these answers with our classmates’ expenses from last year. We used their answers to make another graph for their expenses last year.
Looking at the two graphs, it is easy to compare the expenses for the two years. Some of their expenses increased, but others decreased. This was a very interesting project for us.
注:⑴ graph 图表 ⑵ expense消耗,消费
 |
- 1.
What did the students spend most of their money on?
- A.Books
- B.Movies
- C.Drinks and snacks
- D.Computer games
- A.
- 2.
Which expense of the students’ stayed the same?
- A.CDs
- B.Phone costs
- C.Others
- D.Transportation
- A.
- 3.
What does the word “decrease” mean?
- A.减少
- B.变化
- C.增加
- D.删除
- A.
- 4.
What did the students spend the same money on last year?
- A.Books& Others
- B.CDs & Movies
- C.Movies & Books
- D.all the above
- A.
- 5.
Which of the following is NOT TRUE according to the graph?
- A.Students spent the least money on e-mail and phone costs this year
- B.Students spent the same money on movies and transportation this year
- C.The expenses on e-mails and phones increased from 10% to 16% this year
- D.The expenses on others decreased from 9% to 4% this year
- A.
questions to ask our classmates. First, we asked our classmates how much money they spent in one month.
Then we asked how much money they spent for things like drinks, music, books, movies, computer games,
and other things. Our math teacher helped us make a graph of our classmates' answers.
Then we thought it would be interesting to compare these answers with our classmates' expenses from
last year. We used their answers to make another graph for their expenses last year.
Looking at the two graphs, it is easy to compare the expenses for the two years. Some of their expenses
increased, but others decreased. This was a very interesting project for us.
注:(1) graph 图表 (2) expense 消耗, 消费

B. Movies.
C. Drinks and snacks.
D. Computer games.
B. Phone costs.
C. Others.
D. Transportation.
B. 变化
C. 增加
D. 删除
Then we thought it would be interesting to compare these answers with our classmates’ expenses from last year. We used their answers to make another graph for their expenses last year.
Looking at the two graphs, it is easy to compare the expenses for the two years. Some of their expenses increased, but others decreased. This was a very interesting project for us.
注:⑴ graph 图表 ⑵ expense消耗,消费
 |
小题1: What did the students spend most of their money on?
| A.Books. | B.Movies. | C.Drinks and snacks. | D.Computer games. |
| A.CDs. | B.Phone costs. | C.Others. | D.Transportation. |
| A.减少 | B.变化 | C.增加 | D.删除 |
| A.Books& Others | B.CDs & Movies | C.Movies & Books | D.all the above |
| A.Students spent the least money on e-mail and phone costs this year. |
| B.Students spent the same money on movies and transportation this year. |
| C.The expenses on e-mails and phones increased from 10% to 16% this year. |
| D.The expenses on others decreased from 9% to 4% this year. |
Then we thought it would be interesting to compare these answers with our classmates’ expenses from last year. We used their answers to make another graph for their expenses last year.
Looking at the two graphs, it is easy to compare the expenses for the two years. Some of their expenses increased, but others decreased. This was a very interesting project for us.
注:⑴ graph 图表 ⑵ expense消耗,消费
 |
【小题1】 What did the students spend most of their money on?
| A.Books. | B.Movies. | C.Drinks and snacks. | D.Computer games. |
| A.CDs. | B.Phone costs. | C.Others. | D.Transportation. |
| A.减少 | B.变化 | C.增加 | D.删除 |
| A.Books& Others | B.CDs & Movies | C.Movies & Books | D.all the above |
| A.Students spent the least money on e-mail and phone costs this year. |
| B.Students spent the same money on movies and transportation this year. |
| C.The expenses on e-mails and phones increased from 10% to 16% this year. |
| D.The expenses on others decreased from 9% to 4% this year. |
We wanted to study how students at our school spend money. In order to study this, we made some questions to ask our classmates. First, we asked our classmates how much money they spent in one month. Then we asked how much money they spent on things like drinks, music, books, movies, computer games, and other things. Our math teacher helped us make a graph of our classmates’ answers.
Then we thought it would be interesting to compare these answers with our classmates’ expenses from last year. We used their answers to make another graph for their expenses last year.
Looking at the two graphs, it is easy to compare the expenses for the two years. Some of their expenses increased, but others decreased. This was a very interesting project for us.
注:⑴ graph 图表 ⑵ expense消耗,消费
 |
【小题1】 What did the students spend most of their money on?
| A.Books. | B.Movies. | C.Drinks and snacks. | D.Computer games. |
| A.CDs. | B.Phone costs. | C.Others. | D.Transportation. |
| A.减少 | B.变化 | C.增加 | D.删除 |
| A.Books& Others | B.CDs & Movies | C.Movies & Books | D.all the above |
| A.Students spent the least money on e-mail and phone costs this year. |
| B.Students spent the same money on movies and transportation this year. |
| C.The expenses on e-mails and phones increased from 10% to 16% this year. |
| D.The expenses on others decreased from 9% to 4% this year. |