题目内容
【题目】阅读下面图文,简要回答所给问题。
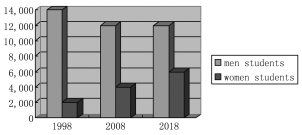
The bar chart shows the number of men and women students studying engineering at Australian universities between the year 1998 and 2018 at tenyear intervals(间隔).
We can learn that the number of male students fell slightly from 14,000 in 1998 to 12,000 in 2008, and then remained the level through the following decade(十年). The number of female students was relatively small, starting 2,000 in 1998.And then it rose slowly, and in 2018 the number was 6,000.
【1】What does the bar chart show us?
______________________________________ .
【2】How many men students chose engineering in 1998?
______________________________________ .
【3】When was the number of female students studying engineering 6,000?
______________________________________ .
【4】How long does the survey last?
______________________________________ .
【5】What do you think of the changes in the chart?
______________________________________ .
【答案】
【1】It_shows_us_the_number_of_men_and_women_students_studying_engineering_at_Australian_universities.
【2】14,000.
【3】In_2018.
【4】For_twenty_years.
【5】I_think_the_changes_are_very_good,_because_it_shows_the_improvement_of_the_society./...(开放性试题,答案合理即可)
【解析】
本文主要内容:柱状图显示了1998年到2018年间澳大利亚大学工程专业的男女学生人数,柱状图是每间隔10年。图表显示从1998至2018年20年间学习工程的学生女生在逐步增加。
【1】题意:柱状图给我们展示了什么?根据第1段The bar chart shows the number of men and women students studying engineering at Australian universities between the year 1998 and 2018 at tenyear intervals(间隔).(柱状图显示了1998年到2018年间澳大利亚大学工程专业的男女学生人数,柱状图是每间隔10年。)可知答案是It shows us the number of men and women students studying engineering at Australian universities.
【2】题意:1998多少男生选择了工程?根据柱状图可知在1998年有14,000男生选择了工程,故答案是14,000。
【3】题意:什么时候学习工程学的女大学生的数量是6000人?根据第2段最后一句The number of female students was relatively small, starting 2,000 in 1998.And then it rose slowly, and in 2018 the number was 6,000.(女生人数相对较少,从1998年到2000年,然后缓慢上升,到2018年达到6000人。)和图表可知在2018年学习工程学的女大学生的数量是6000人。故答案是In 2018。
【4】题意:这项调查持续多长时间?根据第一段he bar chart shows the number of men and women students studying engineering at Australian universities between the year 1998 and 2018 at tenyear intervals(间隔).(柱状图显示了1998年到2018年间澳大利亚大学工程专业的男女学生人数,柱状图是每间隔10年。)可知这项调查是从1998到2018共持续20年;故答案是For twenty years。
【5】题意:你对图表的变化有什么看法?本文主要描述从1998至2018年20年间学习工程的学生女生在逐步增加这种情况,根据此情况回答合理,英文表达正确即可。I think the changes are very good because it shows the improvement of the society./...(开放性试题,答案合理即可)


