题目内容
阅读下面图文,简要回答所给问题。
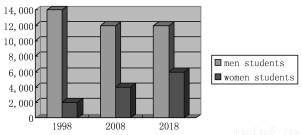
The bar chart shows the number of men and women students studying engineering at Australian universities between the year 1998 and 2018 at ten?year intervals(间隔).
We can learn that the number of male students fell slightly from 14,000 in 1998 to 12,000 in 2008, and then remained the level through the following decade(十年). The number of female students was relatively small, starting 2,000 in 1998.And then it rose slowly, and in 2018 the number was 6,000.
1.What does the bar chart show us?
______________________________________ .
2.How many men students chose engineering in 1998?
______________________________________ .
3.When was the number of female students studying engineering 6,000?
______________________________________ .
4.How long does the survey last?
______________________________________ .
5.What do you think of the changes in the chart?
______________________________________ .

 金钥匙试卷系列答案