题目内容
【题目】Understanding Graphics(图表)
When we are reading, we often see one or two graphics in a text. Have you ever thought about these questions: Why are they there? What information do they give? Do they help with our reading and understanding?
Graphics are things like pictures, maps, charts and tables. They give information to readers. Very often, we can see different kinds of graphics in books, magazines and newspapers. Writers use graphics to get the readers'attention and give them some particular(特别的)information. Graphics help to understand the given information in a text. And graphics put the information in a particular order so that it's easy to understand when we take a quick look.
It is not always true that a picture is worth a thousand words. But many things are easier to show than to tell and they may also be easier to understand. Graphics are just the right things that give a great deal of information but it doesn’t take much time to read and understand.
The right way to read and understand a graphic is to look at the picture and the words together. In a graphic, only a few words are used to explain what the picture shows you. Sometimes, numbers and percentages(百分比) are also given to go with the words to explain things.
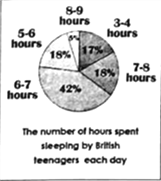
Now look at the graphic on the right. It is how a researcher used a graphic to show the number of hours spent sleeping by British teenagers each day. Can you understand it?
【1】Which of the following is mentioned as a graphic?
A. A letter.
B. A poem.
C. A map.
D. A name card.
【2】The writer thinks graphics are important because ____________.
A. less space is taken on a page
B. a picture is worth a thousand words
C. a lot of time can be saved for writers
D. many things are easier to show than to tell
【3】When we read a graphic, we should ______.
A. find out if there are any tables in it
B. put the information in the right order
C. count how many words there are in it
D. look at the picture and the words together
【4】The graphic given in the passage tells us that ________.
A. 5 British teenagers sleep for 8-9 hours every day
B. Chinese 18-year-olds spend 5-6 hours sleeping every day
C. 17% of the British teenagers sleep for 3-4 hours each day
D. 42% of the Chinese teenagers spend 6-7 hours sleeping each day
【答案】
【1】C
【2】D
【3】D
【4】C
【解析】短文介绍了图表的作用以及如何正确使用图表的方法。图表包括图片、地图、图纸和表格之类的东西。文本中插入图表能帮助读者更直观快捷地理解相关信息,理解图表的正确方法是把图片和文字一起来阅读。
【1】细节理解题。根据第二段中的句子“Graphics are things like pictures, maps, charts and tables.” 图表是图片、地图、图纸和表格之类的东西。地图属于图表,故答案为C。
【2】细节理解题。根据文中第三段中的句子“But many things are easier to show than to tell and they may also be easier to understand. Graphics are just the right things that give a great deal of information but it doesn’t take much time to read and understand.”很多事情比说出来更容易,而且也更容易理解。图表提供了大量的正确信息,阅读和理解并不需要太多的时间。可知作者认为图表是重要的,因为许多东西显示出来比说出来更直观更容易,故答案为D。
【3】细节理解题。根据短文第4段中的句子“The right way to read and understand a graphic is to look at the picture and the words together.”阅读和理解图表的正确方法是把图片和文字一起看。故答案为D。
【4】图表理解题。根据图表下面的文字“The number of hours spent sleeping by British teenagers each day.”可知,图表显示的是英国青少年每天睡觉的时间。通过统计表分析,17%的英国青少年每天睡觉3-4小时,故答案为C。


【题目】阅读下面的图表,完成41~42小题。
| A school in Hunan has changed its playground into a garden full of fruit and vegetables, so that its students can grow and eat their own food. So far the fruit and vegetables have been used in school meals. |
| A great coin collection is going on show in Guangzhou in July, 2018. The exhibition has more than 1,000 kinds of coins. It is said to have taken 10 years to collect. It will have a world tour in March, 2019. |


【1】The playground in a school in Hunan has been changed into________.
A. a new school B. a flower garden C. a fruit and vegetable garden
【2】A coin collection exhibition will be__________.
A. in July, 2018 B. in March. 2019 C. in July. 2028