题目内容
【题目】阅读下列材料,从每题所给的四个选项(A、B、C、D)中,选出最佳选项。
A
Last year, some groups of students in their community made a survey about “How do people spend their free time? ” The following diagrams(图表) show some results of it:
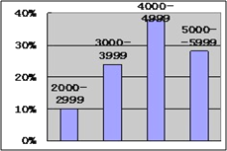
Diagram (1): Hours for people of different ages who surf the Internet in a week.

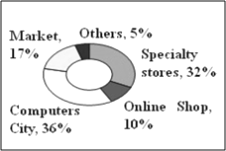
Diagram (2): Different days people go to the library. (library attendance)
![]()

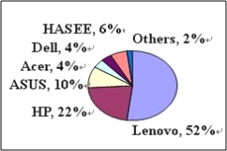
Diagram (3): Different programs people like.

【1】People aged spend the most time surfing the Internet every week.
A. 7~16 B. 17~30 C. 31~55 D. over 56
【2】How many people go to the library on Saturdays?
A. About 20%. B. About 40%. C. Over 60%. D. More than 80%.
【3】Which of the following is TRUE according to the diagrams?
A. People seldom go to the library on weekdays.
B. Sports are the most people’s favorite programs.
C. The fewest people like watching music programs.
D. More people enjoy news programs than cartoons programs.
【答案】
【1】C
【2】A
【3】D
【解析】本文是以图表的形式,学生调查了自己所在的社区的人们在业余时间是怎样度过的,都做了哪些事情。
【1】细节理解题。根据第一个图表可知31—35岁的人每周花费大部分时间上网。故选C。
【2】细节理解题。根据图表二可知,周六20%的人去图书馆。故选A。
【3】细节理解题。根据图表三可知,与卡通节目相比更多的人更喜欢新闻节目。故选D。