摘要:03
网址:http://m.1010jiajiao.com/timu_id_1026975[举报]
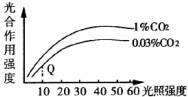
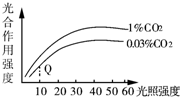
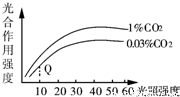
 如图表示的是在CO2浓度为1%和0.03%两种情况下,某农作物的光合作用强度与光照强度之间关系曲线图.据图分析,限制图中Q点光合作用的因素是( )
如图表示的是在CO2浓度为1%和0.03%两种情况下,某农作物的光合作用强度与光照强度之间关系曲线图.据图分析,限制图中Q点光合作用的因素是( )
①CO2浓度,②光照强度.
查看习题详情和答案>>
①CO2浓度,②光照强度.
| A.① | B.② | C.①和② | D.与①②无关 |
如图表示的是在CO2浓度为1%和0.03%两种情况下,某农作物的光合作用强度与光照强度之间关系曲线图.据图分析,限制图中Q点光合作用的因素是( )
①CO2浓度,②光照强度.
A.①
B.②
C.①和②
D.与①②无关
查看习题详情和答案>>
①CO2浓度,②光照强度.
A.①
B.②
C.①和②
D.与①②无关
查看习题详情和答案>>