题目内容
下表是某工厂10个车间2011年3月份产量的统计表,1到10车间的产量依次记为 (如:
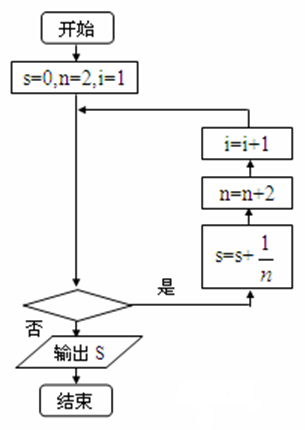
(如: 表示6号车间的产量为980件).图2是统计下表中产量在一定范围内车间个数的一个算法流程图.那么算法流程图2输出的结果是 .
(如:表示6号车间的产量为980件).图2是统计下表中产量在一定范围内车间个数的一个算法流程图.那么算法流程图2输出的结果是 .| 车间 | 1 | 2 | 3 | 4 | 5 | 6 | 7 | 8 | 9 | 10 |
| 产量 | 1080 | 900 | 930 | 850 | 1500 | 980 | 960 | 900 | 830 | 1250 |
6
算法流程图输出的结果是“产量大于900件的车间数”,从表中可知1、3、5、6、7、10共6个车间的产量大于900件.

练习册系列答案
相关题目
 值为( )
值为( )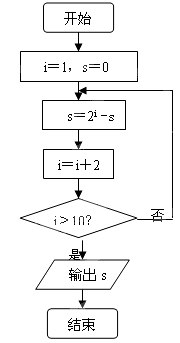
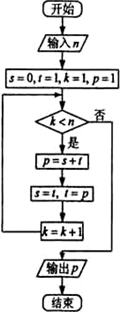
 的值的一个程序框图,其中判断框内应


 ,则运算进行 次才停止;若运算进行
 次才停止,则
 的取值范围是 .
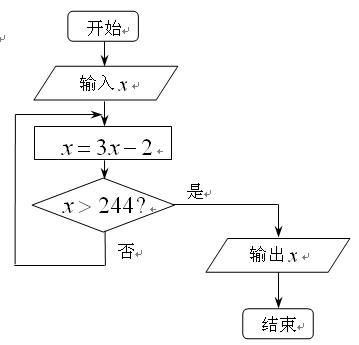
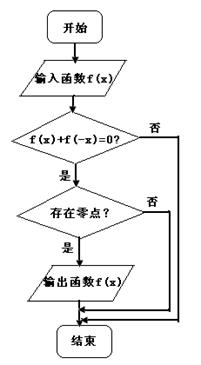
 程图如图所示,现输入如下四个函数,则可以输出的函数是( )