题目内容
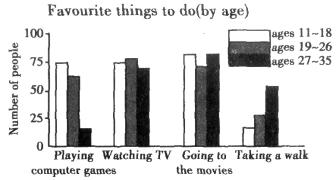
We surveyed(调查)300 young people on what they like to do at weekends. One hundred people are from the ages of 11-18, one hundred 19-26 and one hundred 27-35. The following shows their answers:
1.How many people enjoy playing computer games in the 11-18 group?
A. 20 B. 50 C. 75 D. 80
2.The people of 19- 26 likes ______ best.
A. watching TV
B. going to the movies
C. playing computer games
D. taking a walk
3.Which two activities do most of the people doing?
A. Playing computer games and watching TV
B. Playing computer games and taking a walk.
C. Watching TV and going to the movies.
D. Playing computer games and going to the movies.
4.We know young people don’t like______.
A. watching TV
B. taking a walk
C. going to the movies
D. playing computer games
5.Which of the following is true?
A. The people between 11-18 don’t like taking a walk.
B. The people of 27-35 like watching TV best.
C. People between 19-26 don’t like playing computer games at all.
D. The people between 11-18 like watching TV best.
1.C
2.A
3.C
4.B
5.A
【解析】
试题分析:这篇短文是对300个年轻人周末喜欢做的事情的调查,短文利用图表的形式,展示了三个年龄段的年轻人,在玩电脑游戏、看电视、看电影和散步这四个活动的具体信息。
1.细节理解题。根据表格中的信息可知,图表中白色柱形表示的是11到18岁这个年龄段的年轻人,这里面玩电脑游戏的大约是75个人。故选C。
2.细节理解题。根据表格中的信息可知,19到26岁年龄段的年轻人是灰色的柱体,从图表中可以看出,这个年龄段的人最喜欢看电视,故应该选A。
3.细节理解题。根据图表中的信息可知,在玩电脑、看电视、看电影和散步这四个活动中,不同年龄段的人最喜欢做的是看电视和看电影,故应该选C。
4.细节理解题。根据图表中的信息可知,在玩电脑、看电视、看电影和散步这四个活动中,不同年龄段的年轻人最不喜欢的是散步,因为这个活动参与的人数是最少的,故选B。
5.推理判断题。根据图表中taking a walk这里的内容可知,11到18岁的年轻人中只有十几个人喜欢散步,故A是正确的。根据图表信息可知,27到35岁的年轻人最喜欢的是看电影,故B不对;根据图表的信息可知,19到26岁的年轻人喜欢玩电脑游戏的接近70个,人数是比较多的,故C不对;根据图表中的信息可知,11到18岁的年轻人最喜欢的是看电影,故D也不对。
考点:日常生活类短文阅读。

 期末100分闯关海淀考王系列答案
 小学能力测试卷系列答案