题目内容
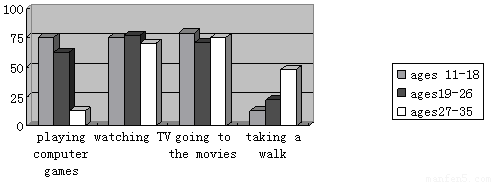
We surveyed 300 young people on what they like to do at weekends. One hundred people are from the ages of 11 - 18, one hundred 19 - 26 and one hundred 27 - 35. The following shows their answers :
【小题1】The people of 19 - 26 enjoy ________ most.
| A.watching TV | B.going to the movies |
| C.playing computer games | D.taking a walk |
| A.Fewest people like taking a walk. |
| B.The people of 11 - 18 like taking a walk most. |
| C.90 people like going to the movies in the 19 - 26 group. |
| D.The people of 27 - 35 like playing computer games most. |
【小题1】A
【小题2】A
解析试题分析:本题是一组条形统计图,主要介绍了各个年龄段的人对于玩电脑游戏,看电视,看电影及散步者四种活动的喜好程度做了对比。
【小题1】根据第二组统计图显示,可知19-26岁的人群最喜欢看电视。故选A。
【小题2】根据四组统计图显示,可知喜欢散步的人最少,故选A。
考点:图表类阅读
点评:本题解答关键是首先要有基础的关于条形统计图的数学知识,然后结合图表内容及英文注释,选出最佳答案。

 一线名师提优试卷系列答案
We surveyed 300 young people on what they like to do at weekends. One hundred people are from the ages of 11-18, one hundred 19-26 and one hundred 27-35. The following shows their answers:
【小题1】The people of 19-26 enjoy ______ most.
| A.watching TV | B.going to the movies |
| C.playing computer games | D.taking a walk |
| A.Playing computer games and watching TV. |
| B.Playing computer games and taking a walk. |
| C.Watching TV and going to the movies. |
| D.Going to the movies and taking a walk. |
| A.Fewest people like taking a walk. |
| B.The people of 11-18 like taking a walk most. |
| C.90 people like going to the movies in the 19-26 group. |
| D.The people of 27-35 like playing computer games most. |
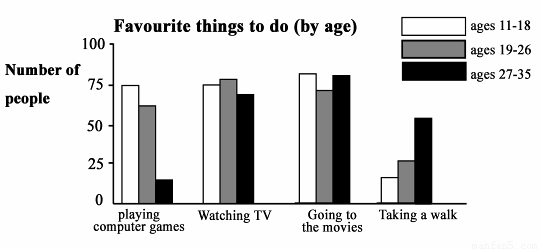
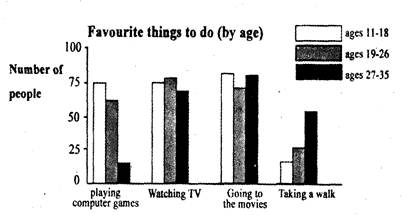
We surveyed 300 young people on what they like to do at weekends. One hundred people are from the age of 11–18, one hundred 19–26 and one hundred 27–35. The following chart shows their answers:
Favourite things to do (by ages)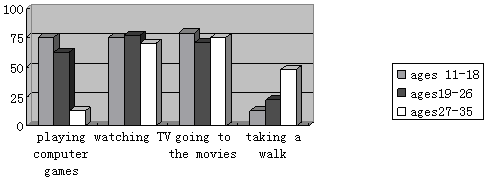
【小题1】According to the survey, which two activities do most people enjoy doing?
| A.Playing computer games and watching TV |
| B.Playing computer games and taking a walk |
| C.Watching TV and going to movies |
| D.Going to movies and taking a walk |
| A.taking a walk | B.watching TV |
| C.going to the movies | D.playing computer games |
| A.All the people like taking a walk most. |
| B.The people of 11–18 like taking a walk least. |
| C.The most people like going to the movies in the 19–26 group. |
| D.The people of 27–35 like playing computer games most. |