题目内容
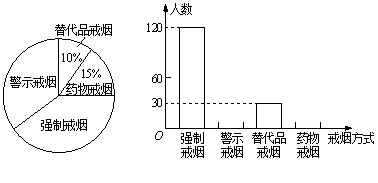
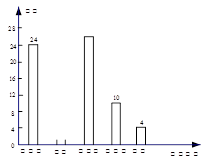
学校为了解全校1600名学生到校上学的方式,在全校随机抽取了若干名学生进行问卷调查.问卷给出了五种上学方式供学生选择,每人只能选一项,且不能不选.将调查得到的结果绘制成如图所示的频数分布直方图和扇形统计图(均不完整).

(1)在这次调查中,一共抽取了 名学生;
(2)选择“步行”上学的学生有 人;
(3)扇形统计图中,“私家车”所对应扇形的圆心角的度数为 ;
(4)估计全校所有学生中有多少人乘坐公交车上学.
(1)在这次调查中,一共抽取了 名学生;
(2)选择“步行”上学的学生有 人;
(3)扇形统计图中,“私家车”所对应扇形的圆心角的度数为 ;
(4)估计全校所有学生中有多少人乘坐公交车上学.
(1)80;(2)16;(3)45;(4)520人
试题分析:(1)根据上学方式为“自行车”的人数及百分比求解即可;
(2)用上学方式为“步行”的所占的百分比,再乘以80即可得到结果;
(3)先求出上学方式为“私家车”的所占的百分比,再乘以360°即可得到结果;
(4)先求出上学方式为“公交车”的所占的百分比,再乘以1600即可得到结果.
(1)在这次调查中,一共抽取了
 名学生;
名学生;(2)选择“步行”上学的学生有
 人;
人;(3)“私家车”所对应扇形的圆心角的度数为
 ;
;(4)被抽到的学生中,乘公交车的人数为80—(24+16+10+4)=26,
∴全校所有学生中乘坐公交车上学的人数约为
 人.
人.点评:统计图的应用是初中数学的重点,是中考常见题,一般难度不大,要熟练掌握.

练习册系列答案
 期末1卷素质教育评估卷系列答案
相关题目